Academic Writing Task 1

The Diagrams Below Show Changes that Have Taken Place in The Sawry District (2) (1)

The Diagrams Below Show Changes that Have Taken Place in The Sawry District

The diagrams below show changes that have taken place in the Sawry District neighbourhood since 1920. Summarise the information by selecting and reporting the main features and making comparisons where relevant. Sample Answer of The Diagrams Below Show Changes that Have Taken Place in The Sawry District The information about the dramatic change that has […]

The Diagrams Below Show Changes that Have Taken Place in The Sawry District Read More »

The Charts Below Show the Percentage of The Energy Generate from Different Resources

The Charts Below Show the Percentage of The Energy Generate from Different Resources

The charts below show the percentage of the energy generate from different resources in a country in 1985 and 2003. To summarize information by selecting key characteristics and compiling a report and, if necessary, making a comparison. Sample Answer of The Charts Below Show the Percentage of The Energy Generate from Different Resources The information

The Charts Below Show the Percentage of The Energy Generate from Different Resources Read More »

The table below shows the top ten countries with the largest population in 2019 (1)

The Table below Shows the Top Ten Countries with the Largest Population in 2019

The table below shows the top ten countries with the largest population in 2019, and how it is projected to change by 2100. Summarise the information by selecting and reporting the main features, and make comparisons where relevant. The table below summarizes the top ten countries with the largest habitats in millions in 2019 and

The Table below Shows the Top Ten Countries with the Largest Population in 2019 Read More »

The Graph Below Shows how Elderly People in The United States (1)

The Graph Below Shows how Elderly People in The United States

The graph below shows how elderly people in the United States spent their free time between 1980 and 2010. Summarise the information by selecting and reporting the main features, and make comparisons where relevant. The given line graph depicts how the aged spent their leisure time in the United States between the years 1980 and

The Graph Below Shows how Elderly People in The United States Read More »

The Chart Below Shows Information About the Challenges People Face (1)

The Chart Below Shows Information About the Challenges People Face

The chart below shows information about the challenges people face when they go to live in other countries. Summarise the information by selecting and reporting the main features, and make comparisons where relevant. The given bar graph illustrates information regarding the average percentage of integration challenges in different age groups. Moreover, it is categorized into

The Chart Below Shows Information About the Challenges People Face Read More »

The Chart Below Shows the Number of Men and Women in Further Education in Britain

The Chart Below Shows the Number of Men and Women in Further Education in Britain

The chart below shows the number of men and women in further education in Britain in three periods and whether they were studying full-time or part-time. Summarise the information by selecting and reporting the main features, and make comparisons where relevant. The bar chart conveys statistics of men and women in Britain who studied at

The Chart Below Shows the Number of Men and Women in Further Education in Britain Read More »

The Bar Chart Below Shows the Popularity of Well-Known Instagram Accounts in 2011 and 2021 (2) (1)

The Bar Chart Below Shows the Popularity of Well-Known Instagram Accounts in 2011 and 2021

The bar chart below shows the popularity of well-known Instagram accounts in 2011 and 2021. Summarise the information by selecting and reporting the main features, and make comparisons where relevant. Sample Answer of The Bar Chart Below Shows the Popularity of Well-Known Instagram Accounts in 2011 and 2021 The bar chart compares in millions the

The Bar Chart Below Shows the Popularity of Well-Known Instagram Accounts in 2011 and 2021 Read More »

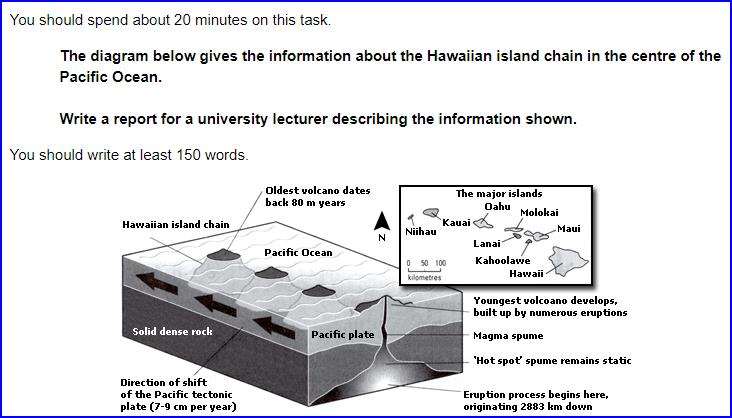
The Diagram Below gives information about the Hawaiian Island chain

The Diagram Below Gives Information About the Hawaiian Island Chain

The Diagram Below gives information about the Hawaiian Island chain in the centre of the Pacific Ocean. Write a report for a university lecturer describing the information shown. Sample Answer of The Diagram Below Gives Information About the Hawaiian Island Chain The diagram inside the rectangular box indicates the location of the Hawaii island in

The Diagram Below Gives Information About the Hawaiian Island Chain Read More »

The Bar Charts Below Provide Information About Honey Production

The Bar Charts Below Provide Information About Honey Production

The bar charts below provide information about honey production and honey-producing colonies in the five American states in 2006. Summarise the information by selecting and reporting the main features, and make comparisons where relevant. Sample Answer of The Bar Charts Below Provide Information About Honey Production The given bar charts depict the comparison of bee

The Bar Charts Below Provide Information About Honey Production Read More »

The Maps Below Show the Town of Lynnfield in 1936 and Then Later in 2007 (2) (1)

The Maps Below Show the Town of Lynnfield in 1936 and Then Later in 2007

The maps below show the town of Lynnfield in 1936 and then later in 2007. Summarise the information by selecting and reporting the main features, and make comparisons where relevant. The maps provide information about the city of Lynnfield in the year 1936 and how it had been in the year 2007. Overall the master

The Maps Below Show the Town of Lynnfield in 1936 and Then Later in 2007 Read More »

Scroll to Top