
The bar charts below provide information about honey production and honey-producing colonies in the five American states in 2006. Summarise the information by selecting and reporting the main features, and make comparisons where relevant.
Sample Answer of The Bar Charts Below Provide Information About Honey Production
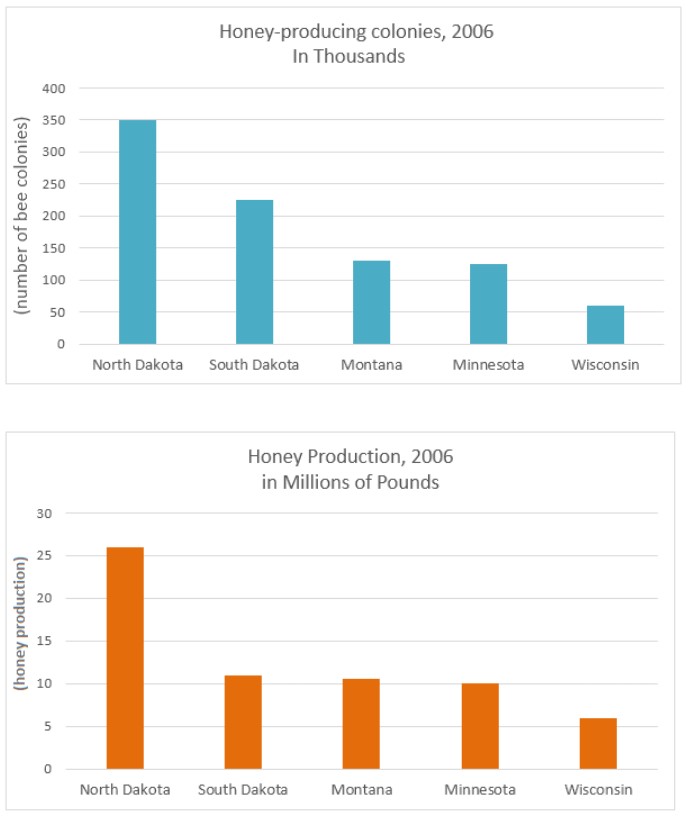
The given bar charts depict the comparison of bee colonies and honey production in five various USA states in the year 2006.
Overall, North Dakota was the highest honey producer, and they have the largest number of bee colonies. As opposed to this, Wisconsin was the least producer and held only the lowest count of colonies.
North Dakota had 350 thousand honey colonies from which they produced more than 25 million pounds of honey. Whereas with more than 50 honey colonies, Wisconsin produced only one by the fifth of North Dakota’s total honey production.
South Dakota and Montana were the second and third largest honey generating states which account for approximately 210 and 140 beehives respectively, however both states producing the same amount of honey which was just over 10 million pounds. Minnesota was producing 10 million pounds of honey from the 130 honey hives.
Follow Us on IELTSFever Instagram
Also, Read A Friend Has Agreed to Look after Your House and Pet while You Are on Holiday
Leave a Reply