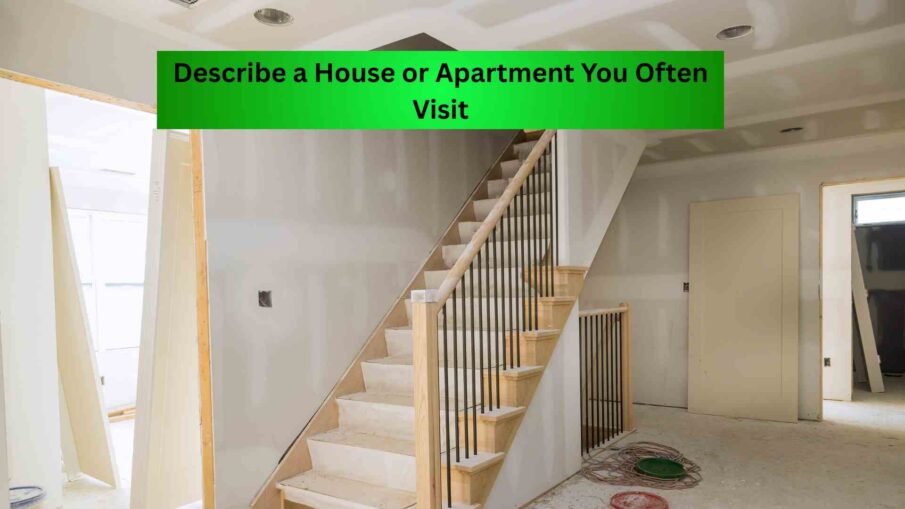
Manpreet Singh

The Charts Below Show the Percentage of Food Budget the Average Family Spent on Restaurant Meals in Different Years

The Charts Below Show the Percentage of Food Budget the Average Family Spent on Restaurant Meals in Different Years

The charts below show the percentage of food budget the average family spent on restaurant meals in different years. The graph shows the number of meals eaten in fast-food restaurants and sit-down restaurants. Write a …

The Charts Below Show the Percentage of Food Budget the Average Family Spent on Restaurant Meals in Different Years Read More »

The Table Below Shows the Sales at A Small Restaurant in A Downtown Business District AC Writing Task 1

The Table Below Shows the Sales at A Small Restaurant in A Downtown Business District: AC Writing Task 1

The table below shows the sales at a small restaurant in a downtown business district. Summarize the information by selecting and reporting the main features, and make comparisons where relevant. The given table depicts information about …

The Table Below Shows the Sales at A Small Restaurant in A Downtown Business District: AC Writing Task 1 Read More »

The Manufacturing and Use of Cars Damage the Environment but Their Popularity Is Increasing (4)

The Manufacturing and Use of Cars Damage the Environment but Their Popularity Is Increasing

The manufacturing and use of cars damage the environment but their popularity is increasing. Why is this? How could this be controlled? We are living in the technological era. There are many advancements that occur …

The Manufacturing and Use of Cars Damage the Environment but Their Popularity Is Increasing Read More »

The Chart Below Shows Estimated World Literacy Rates by Region and By Gender for The Year 2000 (4)

The Chart Below Shows Estimated World Literacy Rates by Region and By Gender for The Year 2000

The chart below shows estimated world literacy rates by region and by gender for the year 2000. Write a report for a university lecturer describing the information below. The bar graph provides information on the aggregated …

The Chart Below Shows Estimated World Literacy Rates by Region and By Gender for The Year 2000 Read More »

Scroll to Top