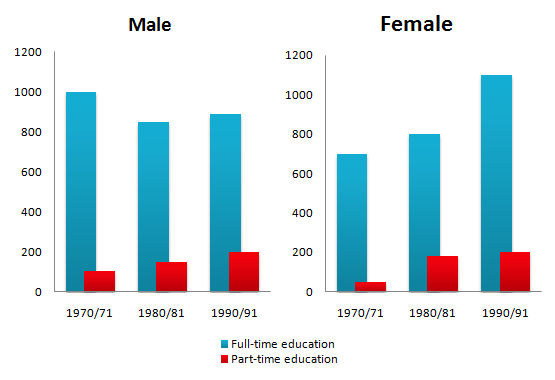
The chart below shows the number of men and women in further education in Britain in three periods and whether they were studying full-time or part-time. Summarise the information by selecting and reporting the main features, and make comparisons where relevant.
The bar chart conveys statistics of men and women in Britain who studied at the tertiary level in three periods studying as full – time or part-time.
With a reflective overall, it is depicted that the number of men and women who chose to study full-time is higher than those who opted for part-time during the three year period in Britain.
From the chart, it is observed that in the year 1970/71 year period the number of males who studied as full-time students was 1000 in number as compared to the females in the same year period recording 700. There was a vast difference between those that enrolled as part-time as the males had 100 and with females around 50 in number. In the year 1980/81 period, there was a decline in the number of men enrolled in full-time studies as they were 800 in number but that of the females gained a rise from 700 to 800. Again the females and males in the part-time studies both had an increase in numbers with the males having 100 to 150 whilst the females recording 50 to 180 in numbers.
It is observed that in the period of 1990/91 the number of males who studied as full-time students was 900 as compared to the females numbering 1100. There was an equal threshold of numbers for both males and females studying as part-time students, each having 200 in numbers.
Follow Us on IELTSFever Twitter
Also Read The Bar Charts below Provide Information about Percentages of Students

