 in Six Different Countries (4) (1)")
The table below shows the amount of waste production (in millions of tonnes) in six different countries over a twenty-year period. Summarize the information by selecting and reporting the main features, and make comparisons where relevant.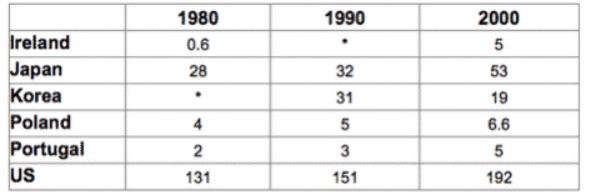
The table illustrates the waste production data in millions of tones over the 2 decades in six different countries.
In the year 1980, US waste production was maximum with 131 million tons, and Ireland was at least (only 0.6 million tons). However, there was no waste in Korea although, in Japan, Poland and Portugal were 28, 4 and 2 million tons respectively. After 10 years (in 1990) in the US, waste production was increased by 20 million and reached 151, and Korea also took a sharp rise and reached 31 million tons from nil. Ireland had also vanished its waste and reached to nil and remaining Japan, Poland and Portugal were at 32, 5 and 3 million tons respectively.
Lastly, in the year 2000, the US remained at the top with 192 million tons, and Ireland and Portugal were equivalent to each other (5 million tons each), and the waste products from Japan, Korea, and Poland were at 53, 19 and 6.6 million tons respectively.
Overall, over the span of twenty years, waste production from japan and US increased continuously.
Follow Us on IELTSFever Twitter
Leave a Reply