The Map of a City in 1950 and now. Summarise the information by selecting and reporting the main features, and make comparisons where relevant.
 Sample Answer of The Map of A City in 1950 and Now. Academic Writing Task 1
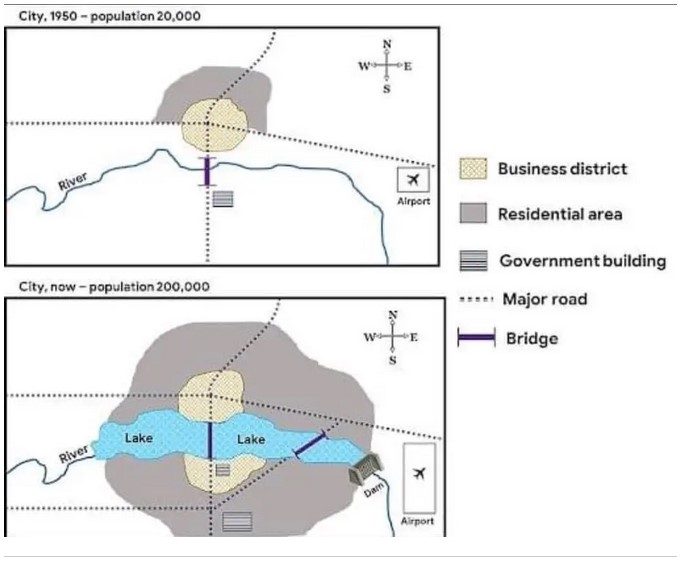
The map below shows the city development from 1950 till now. The city also increased the population from 20,000 in 1950 to 20,0000 in the present time.
In 1950 the city had a less residential area on the north side, and around the residential area, there was a business district. Moving ahead, there was a government building across the river, and to cross the river, there was only one bridge. The airport is on the east side of the city, and only one major road cover the distance of the city.
But now the city is developed, and there are also many changes. The residential area covers most parts of the city. It is now almost all over the city, and now the business district is now cover the area which is across the river. Moreover, there are two new government buildings one is in the business district, and one is in the residential area; both buildings are in the south area of the city. Aiport is still In the southeast side of the city, but there is a new dam has been built near at the airport and also city has now two bridges which are helpful to cross the river and also many new roads is now available in the city.
Overall, due to the rise in population city has been now developed, and many areas of residential are available for the people to live in the city.
Follow Us on IELTSFever Twitter
Leave a Reply