")
The bar chart shows the percentage of households with cars in a European country between 1971 to 2001. Summarize the information by selecting and reporting the main features, and make comparisons where relevant.
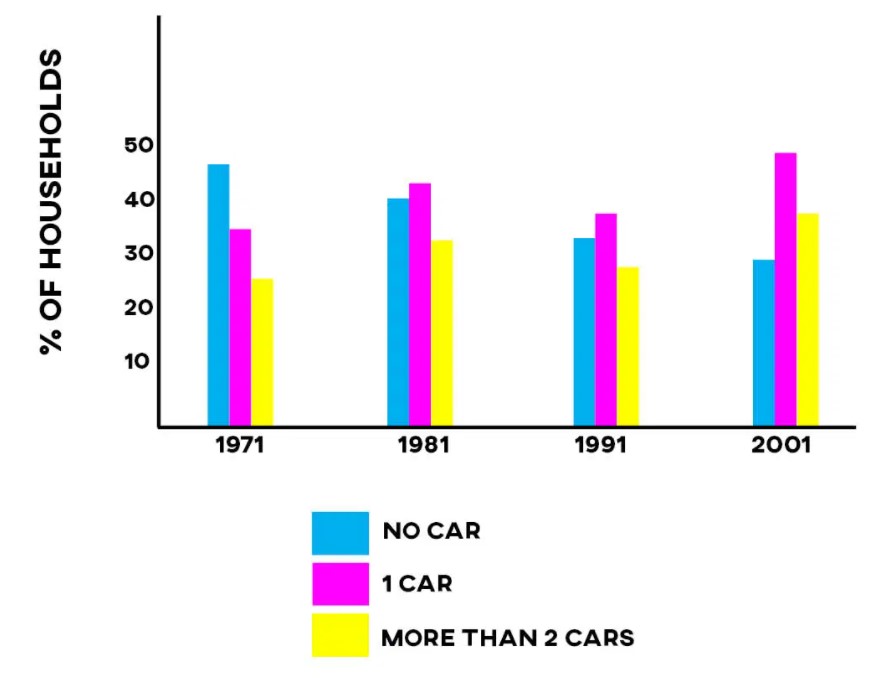
The bar graph demonstrates the proportion of European families who had cars from the year 1971 to 2001.
Overall, the percentage of households with no car in 1971 was highest whereas in the year 2001 the families with one car were highest.
At a fleeting glance, it is clearly seen that the proportion of families with no car, 1 car and 2 cars were different from 1971 to 2001. Firstly, the percentage of households with no car was 48% in 1971. In the same year, the proportion of households with one car and more than one car was 35% and 25%. After 10 years, in 1981, the proportion of our families with no car was reduced up to 39%, and with 1 car it was approximately 42%, and with more than two cars it also increased to 30%. Similarly, after one decade, there were minor changes in the household who owed cars as the percentage of families with no car was 30% and with the one car the percentage was almost 36%, and families with more than two cars were almost 27% in 1991.
In 2001 the proportion of families with a car had many changes from 1971. The proportion of families with no car and one car was 25% and 48% respectively.
Follow Us on IELTSFever Twitter
Also, Read The Charts below Show Local Government Expenditure in 2010 and 2015
Leave a Reply