")
The graphs indicate the source of complaints about the bank of America and the amount of time it takes to have the complaints resolved. Summarise the information by selecting and report in the main features, and make comparisons where relevant. Write at least 150 words.
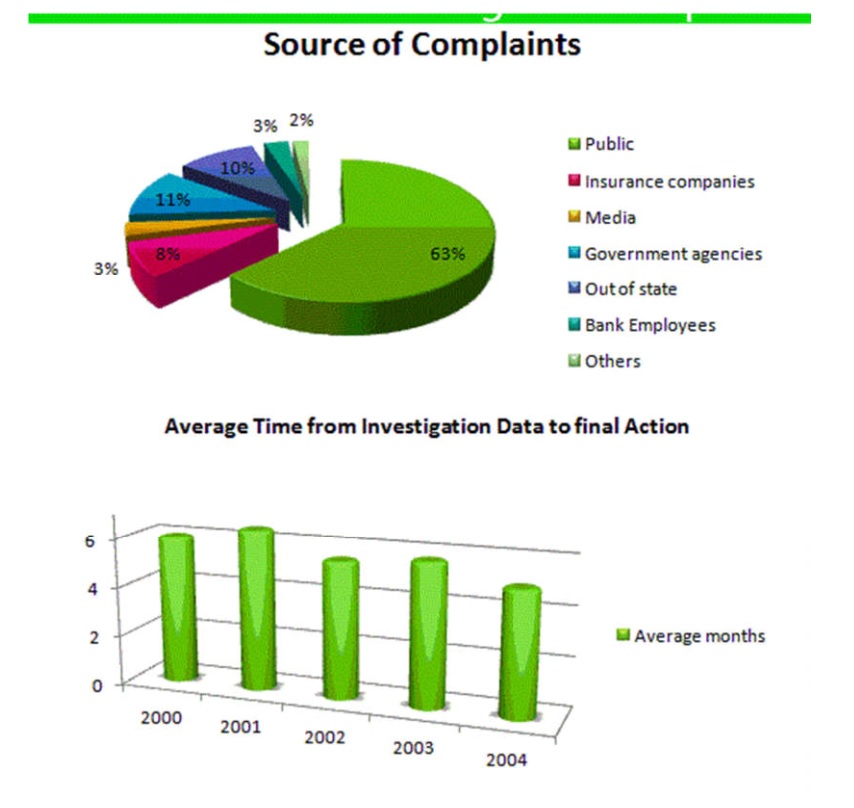
The pie chart and bar graph depicts the Complaints made by various sources regarding the Bank of America and the average time required to solve complaint.
It is vivid from the pie chart; maximum complaints were made by public and government Agencies, their figure was 63 % and 11% respectively. After that, the least complaints were reported by others, merely 2%. Interestingly a similar percentage of complaints were reported by the media and Bank of employees. 10% of complaints came from out of state.
Moving towards the bar graph, it is seen, in 2000, Bank of America took almost five months to solve the problem. After that, half a year was needed by the bank to took for investigation in 2001. In 2002 and 2003, the bank utilised almost five months to tackle complaints, and in 2004, a time of almost 4.5 months was taken by the bank to investigate.
Hence, people’s highest complaints were made, and maximum time was needed in 2001 to investigate the objections.
Follow Us on IELTSFever Twitter
Also, Read The Graphs Show Changes in the Spending Habits of People in the UK
Leave a Reply