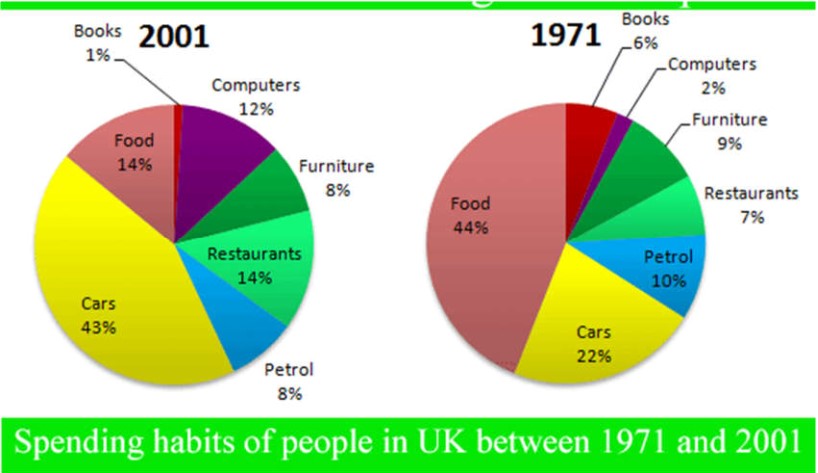
The graphs show changes in the spending habits of people in the UK between 1971 and 2001. Write a report to a university lecturer describing the data. Write at least 150 words
Sample Answer of The Graphs Show Changes in the Spending Habits of People in the UK
The information presented to compare and contrast the difference about the changes in people’s habits in the UK between 1971 and 2001 which is shown by two pie charts. The units are calibrated in percentile.
In an overview, It is crystal clear from the chart that in initial nearby BritishIan consumed food whilst, in final year spend on cars.
Initially, it is witnessed from the chart that human beings spend less time on books less than a tenth in the initial year. However, it is a more than 5% in 2001. the percentage of masses who spend time on computer and furniture had been 2 and 9 respectively in 1971. after three decades, souls used more computers than a tenth, whereas furniture used by mobs was 8%.
Probing ahead 7% citizens of UK used the restaurant in starting years while as, it was double at the end of the year. The petrol consumed by residents of UK was 10% and 8% respectively in both years. The percentile of cars was 43% in 2001, which is double in 1971. interestingly 44% of people interested in food in the initial year, in contrast, 14% used it in 2001.


Leave a Reply