")
The graphs show changes in the spending habits of people in the UK between 1971 and 2001. Write a report to a university lecturer describing data.
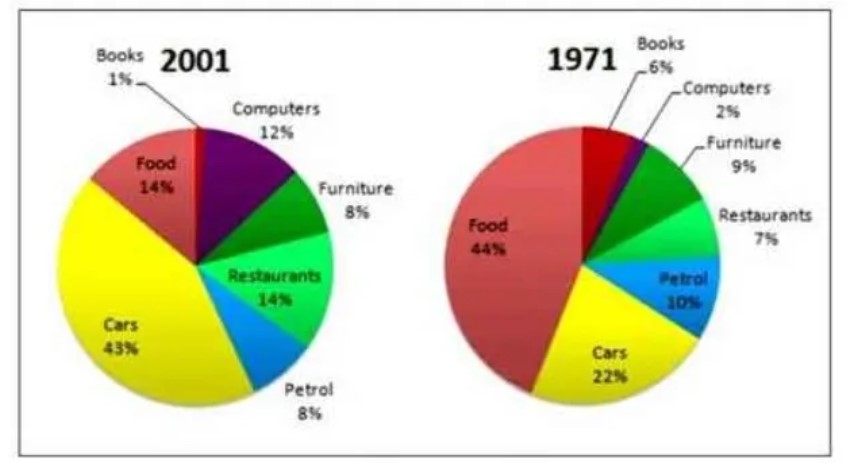
The given pie charts illustrate the expenditure of British in between 1971 and 2001. They have spent in seven different essentials which are cars, food, petrol, restaurant, furniture, books and computers.
Overall it is clear that people in the United Kingdom spend most on cars and food, and the least spent on books and computers in given years.
To begin within 1971, British spent over a two-fifth for eating food(44%), and it is obvious that the least spent on computers which are only 2%. The second most expenditure on cars was over a fifth(22%). The rest of the essentials they proportioned with almost equally which is petrol and furniture 10% and 9% respectively. Furthermore, restaurant expenses accounted for 7% and the remaining 6% was shared for books.
In contrast, in 2001 a significant amount was spent on cars which Are 43%, and the amount they used on books fell to just 1% when compared to 1971. For the food and restaurant, people in the UK equally accounted which is 14% moreover for the furniture as well as petrol also shared the equal proportion, it was 8%. Last but not least the rest of the proportion accounted for computers.
Follow Us on IELTSFever Twitter
Leave a Reply