 (1)")
The graphs below show the numbers of male and female workers in 1975 and 1995 in several employment sectors of the Republic of Freedonia. Write a report for a university teacher describing the information shown.
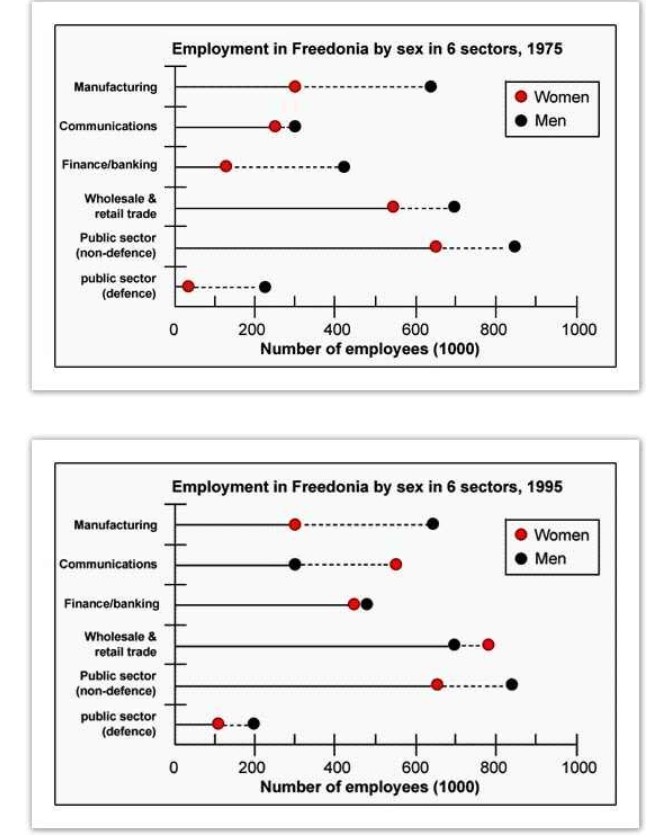
The given line graphs depict the counts of both male and female employers in 6 different job sectors of Republic of Freedonia in the year 1975 and 1995
Overall, it can be seen that most of the occupations were equipped with men while women were consistently accounted for limited seats. whereas after more than a decade of the first-mentioned year the women overtook the men in a few employment sectors.
In 1975, all 6 labor services were surprised with men than women. Both the men and women were significantly cemented their careers in the manufacturing field which was accounted for nearly 850 and 650 per 1000 respectively, on the contrary, the least favorable job for both genders was defense in the public sector, in this job women only accounted for 10 whereas more than 200 men were working under this section. Communication was the only one job where both genders were equally distributed despite if a small numerical difference
In 1995, women leave behind men in two professions such as communication and wholesale and trade. The highest men working sector was a public sector in the nondefense zone ( nearly 850) whereas women displayed their highest skill in wholesale and trade(800). Moreover in manufacturing, the women and in communication the men were uniformly spaced (250).In the profession of finance and banking both gender fairly seated which occupied nearly 450 per 1000.
Follow Us on IELTSFever Twitter
Also, Read Different Age Groups in One City Who Attended Music Concerts
Leave a Reply