 (1)")
The graph below shows the information about cases regarding covid-19. Summarise the information by selecting and reporting the main features, and make comparisons where relevant.
Sample Answer of The Graph below Shows the Information about Cases Regarding Covid-19
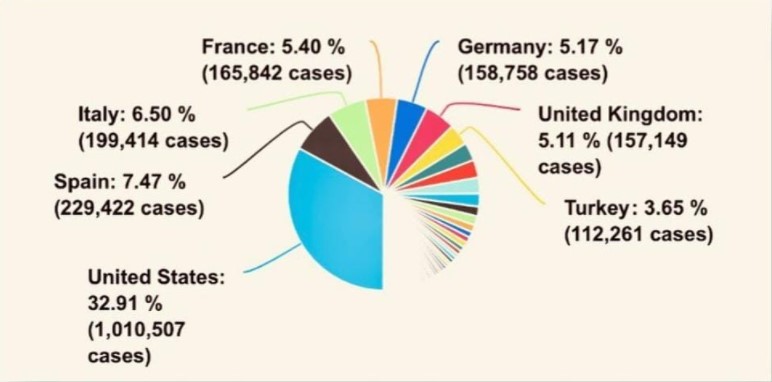
The pie chart compares statistics related to Covid 19 patients.
Overall, the USA had a significantly higher record of Covid 19 cases, which was similar to that of five countries combined. Another portion equal to that of USA was occupied by other nations which were not listed by name on the chart.
The worst outbreak was witnessed in the United States, which had a record high of 1 010.507 Covid 19 victims. However, this was nearly ten times higher than that of Turkey, which was the lowest among the six countries listed on the chart, trailing at 111.261 Covid 19 patients. Other unspecified nations altogether documented Covid 19cases, which were almost similar in proportion to the USA.
They were considerable differences between the USA and the five other states. Spain followed at 7.47% against 32.91%, which had been recorded in the United States. Italy, France, Germany, and the United Kingdom had a consistent rate of Covid 19 outbreaks recording figures around 160.000 to 230.000 patients.
Follow Us on IELTSFever Instagram
Also, Read A Friend Has Agreed to Look after Your House and Pet while You Are on Holiday
Leave a Reply