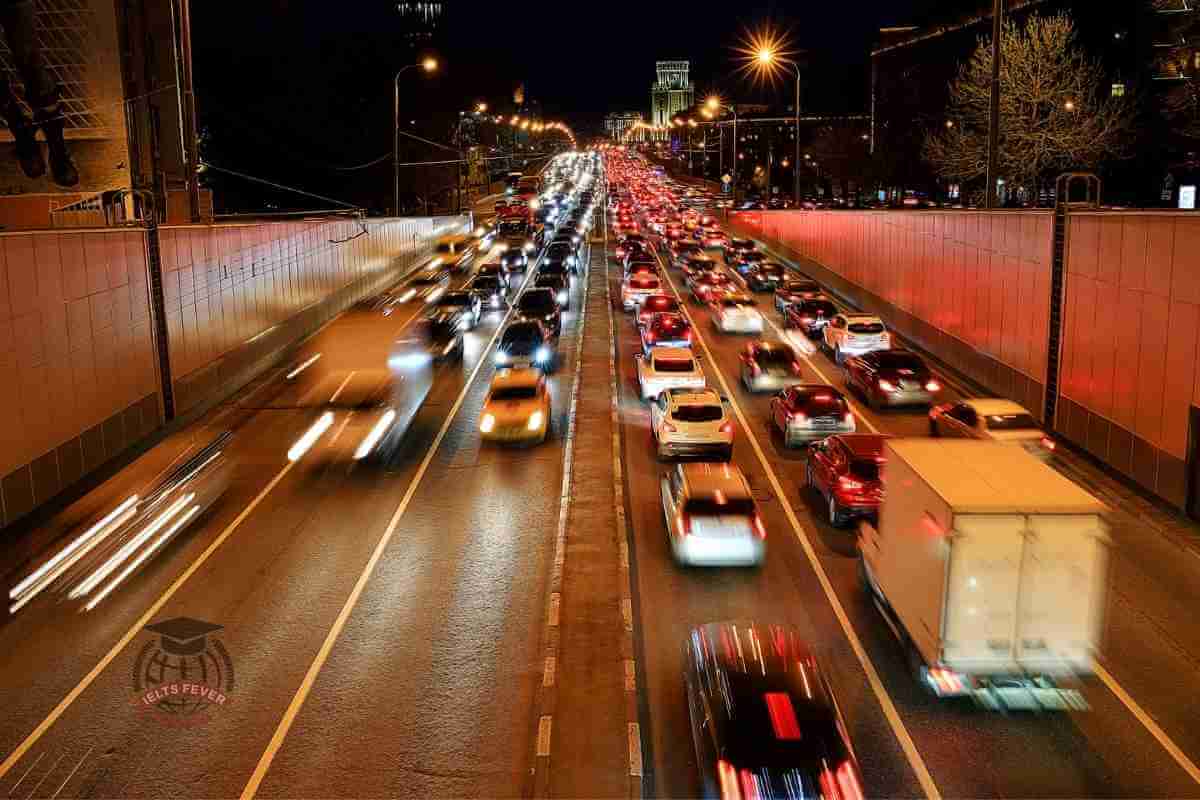
The diagrams below give information on transport and car use in Edmonton. Summarise the information by selecting and reporting the main features, and make comparisons where relevant.
The diagram provides data on transport and vehicle patronage in Edmonton.
Overall, it is seen that Car was the primary mode of transport used (45%) whiles taxi and bus recorded the most miniature mode of transport used (10%). The primary reason for the high car patronage in the city is seen to be the use of Car for the commute to work.
To start with, the mode of transport in this city were categorized into four, Car, LRT, Bus and Taxi. Whereby Car recorded the highest mode of transport (45%) whiles LRT recorded the second-highest (35%). Also, taxis and buses recorded the same amount of usage (10%) each.
Furthermore, the people had different reasons for the usage of Car. The most dominant reason was seen to be for going to work (55%) whiles the fewest reason was seen to be for both shopping and leisure activities, which recorded 15% each. Moreover, business purposes recorded the second-highest percentage (45%) with a slight amount overusing it to convey children to school (40%).
Follow Us on IELTSFever Twitter


Leave a Reply