")
The bar chart shows the number of cars per 1000 people in 5 European countries in 3 years and compares with the European average. Summarise the information by selecting and reporting the main features and make comparisons where relevant.
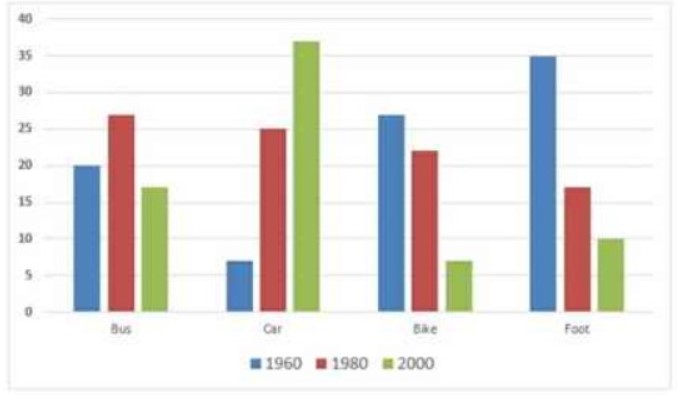
The chart illustrate the digit of 5 European countries by 1000 populations of Cars,Bus,Bike and Foot in the year of 1960,1980 and 2000 these are differentiate with similarities in the British standard.
Overall the numeral of 5 In the United kingdom by 1000 individuals within 3 years was highest in 2000. Both in 1960 and 1980 are fluctuating till the end of the period.
In 2000, Cars was the climax per 1000 persons in their State of above 35% then it went to almost 15% in bus and dip down of 10% in foot continue to decline steadily to the end period of approximately 7% in bike.
While in 1960 foot was climbed to the peak of 35% and dropped to about 27% in bike . From there it decreased to 20% in Bus and gradually reached to the bottom of 7%.Similarly,In 1980 the Bus was around 27% that was slightly go to 25% and nearly 22% in Car and Bike then they deep to the range of roughly at foot 17% in the last year.
Follow Us on IELTSFever Twitter
Also Read The Chart Below Gives Information About “istanbul Promo Plus”
Leave a Reply