 (1)")
The table below gives information about changes in modes of travel in England between 1985 and 2000. Summarise the information by selecting and reporting the main features, and make comparisons where relevant.
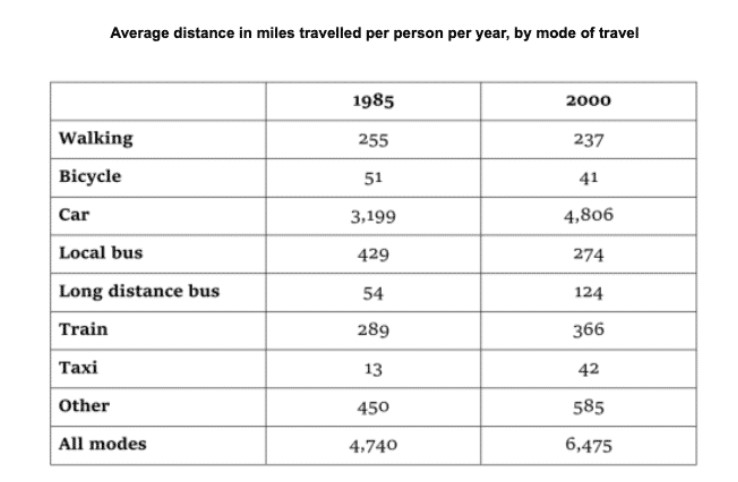
In 1985 the majority of England population preferred to travel via car and cover the distance of 3199 miles per year every individual whereas the least was travelled by taxi which was only 13 miles. However, in the year 2000, the first preference is still a car and much more than previous and travelled 4806 miles, but in this year people least prefer to bicycle and travel only 41 miles per year however demand of taxi had increased and reached to 42 miles per year.
Furthermore, In the year 2000, people preferred less to walk and cover only 237 miles which were 255 miles 15 years back. On the other hand, few transportation demand got increased during 15 years, such as Local distance bus, Train and others, i.e. 54, 289, and 450 miles to 124, 366 and 585 respectively. Lastly, The demand for Local buses declined drastically from 429 to 274 miles per year.
Overall, over the span of 15 years population of England travelled more miles in 2000 than in 1985 and reached 6475 miles from 4740 miles.
Follow Us on IELTSFever Twitter
Leave a Reply