 (1)")
The line graph shows visits to and from the UK from 1979 to 1999, and the bar graph shows the most popular countries visited by UK residents in 1999. Summarize the information by selecting and reporting the main features and making comparisons where relevant.
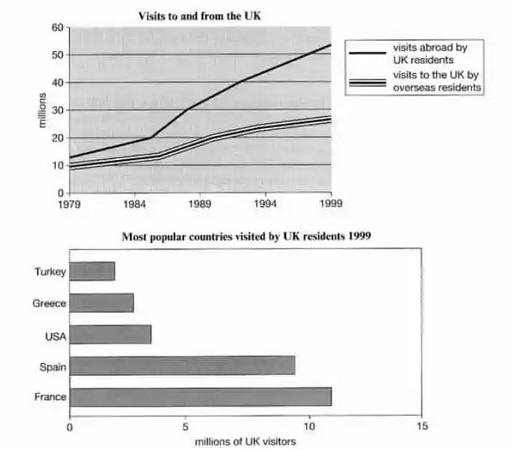
The line graph illustrates the people who visit Britain and the people who visit abroad from Britain between 1979 to 1999, while the bar graph describes the people who visited the most popular countries in the UK.
Overall, it can be said that the number of individuals who visited the Uk and the people who visited another country from the UK increased significantly over the given period, whereas many individuals visited France in 1999 and which was the well-known country for residents of the UK.
In detail, in 1979, around 13 million people visited abroad from Britain, while 10 million people from the globe visited the UK. From 1979 to 1984, people who visited abroad was increased slightly, and in 1984, 20 million people visited abroad. In contrast, around 12 million people have visited the UK. There was a sharp surge in people who visited other countries. However, people who visited Britain rose significantly.
Moving on to the bar graph, roughly 13 million people visited France, which was the most popular county for residents of UK, whilst Turkey was the least popular country for local people of Britain, little less than 5 million people visited. Spain was the second most popular country for people of UK, around 10 million people visited Spain in 1999. In the case of the USA and Greece, roughly 3 million and 4 million people visited in 1999 respectively.
Follow Us on IELTSFever Twitter
Leave a Reply