")
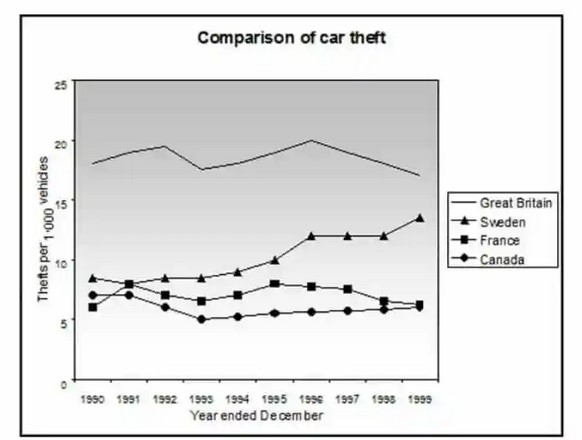
The line graph shows thefts per thousand vehicles in four countries between 1990 and 1999. Summarize the information by selecting and reporting the main features and making comparisons where relevant.
 Sample Answer of The Line Graph Shows Thefts per Thousand Vehicles in Four Countries Between 1990 and 1999
The given line graph illustrates the comparison of car thefts between four countries; Great Britain, France, Canada, Sweden, from 1990 to 1999.
Overall, the number of thefts was maximum in Great Britain while the least in Canada throughout the time period.
Moving on the details, In 1990, The number of car thefts in Great Britain was highest compared to other countries accounted as 17 per thousand. The number of thefts in Britain was fluctuated till 1999 and reached 15 per thousand. The figure for car thefts in Sweden began at 8 per thousand, it followed an increasing trend from 1991 to 1998 and stood at almost 15 per thousand in 1999.
Moving further, the Cases of car thefts was started at 6 and 7 in France and Canada, and both countries followed the opposite trend between 1992 to 1998. In 1999, the number of thefts in Sweden and Canada was equal accounted for over 5 per thousand.
Follow Us on IELTSFever Twitter
Leave a Reply