")
The graph below shows the number of hours per day on average that children spent watching television between 1950 and 2010. Summarise the information by selecting and reporting the main features, and make comparisons where relevant.
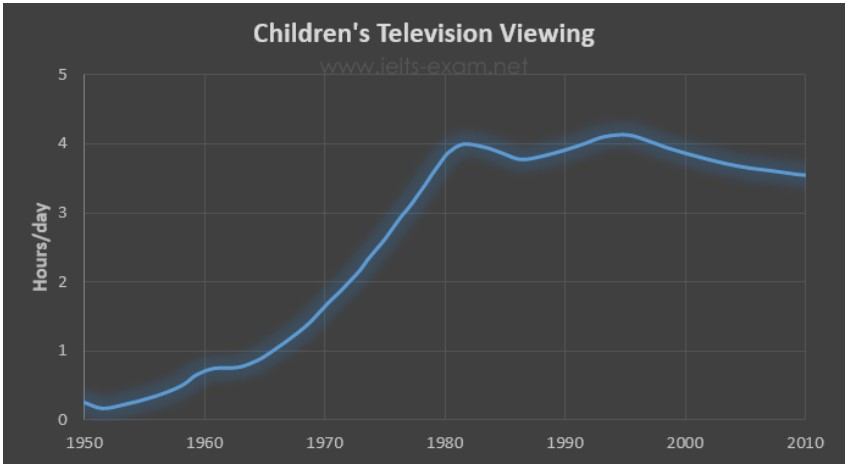
The line graph illustrates the number of times a day children spend viewing television from 1950 and 2010.
Overall, it is noticed that the average hour’s children used in watching television had increased significantly during the sixty-year intervals.
In 1950, the number of hours children spent per day view television was 0.2. It then raised to 0.8 hours of watching television per day in 1960 from there it highly inclined from 0.8 to 1.8 with intervals of 1 hour. Again we can observe that how children watch television rapidly elevated to 4 hours per day in 1980.
Furthermore, the hour’s children spent viewing television a day went through short fluctuations from 1980 to 1995. It decreased to 3.8 in 1985 and then raised to 4.1. After a little increase in 1995, the hours then dropped from 4.1 to 3.7 in 2010.
Follow Us on IELTSFever Twitter
Leave a Reply