 (1)")
The graph below shows the average monthly use of health clubs in Miami and Florida by all full-time members in 2017. The pie charts show the age profile of male and female members of this health club. Summarise the information by selecting and reporting the main features, and make comparisons where relevant.
 Sample Answer of The graph below shows the average monthly use of health clubs in Miami and Florida
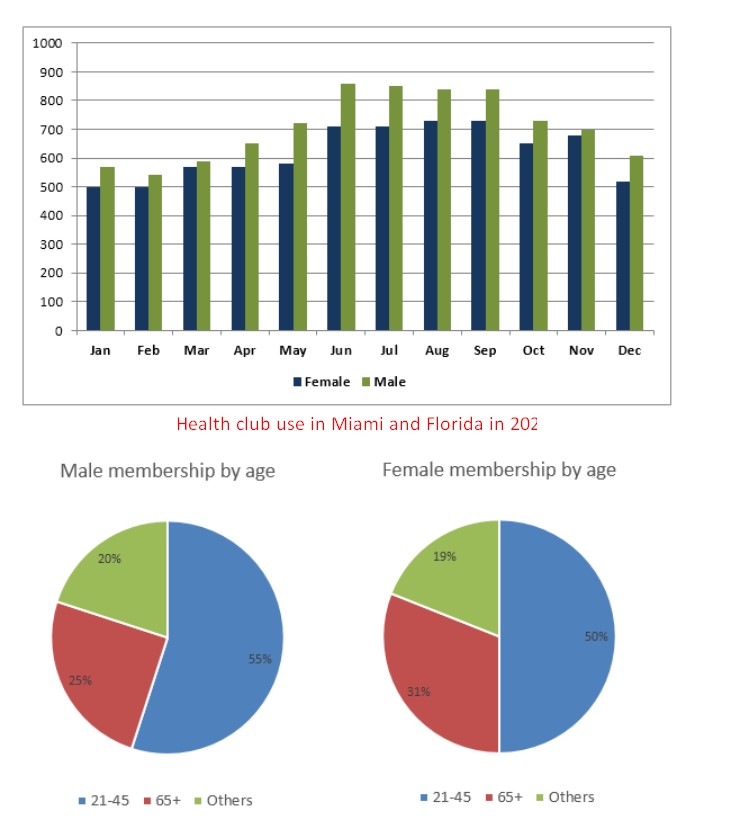
The charts illustrate the use of health clubs in Miami and Florida in the year 2017. The pie chart shows the age group of male and female members of this health club.
Male members are using the club in June above 800. But in the month of February, male users are using only 550. In the case of female users, using a high number of the month in August and September, but in the month of January and February, they are using below 500. This chart showing male members are using more in this health club in the case of female members.
The age of 21 to 45 male members is more than female members. That is, male members are 55%, and female members are 50%. The next is above 65 age group that is male is 25% in the case of the female is 6% is high that is 31%. The other members are male group is 20%, and the female group is 19% So comparatively male users is more than female users.
Follow Us on IELTSfever Instagram
Also, Read Describe a Place Full of Colours?
Leave a Reply