 (1)")
The diagrams below show the main reasons workers chose to work from home and the hour’s males and females worked at home for the year 2019. Summarise the information by selecting and reporting the main features, and make comparisons where relevant.
Sample Answer of The Diagrams Below Show the Main Reasons Workers Chose to Work from Home
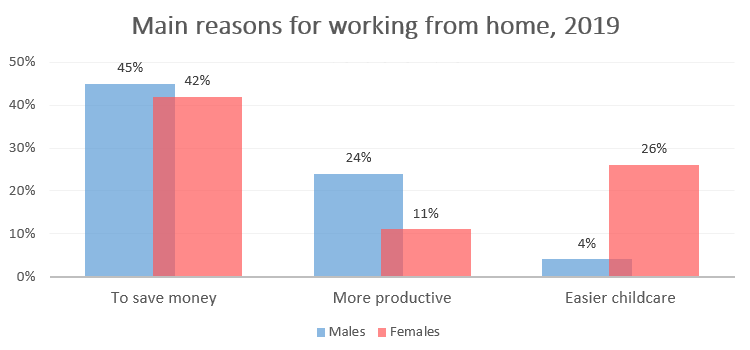
The bar chart illustrates the information about the particular reason employees take tasks from home and the hour’s and women work at home in the year 2019.
In case of to save money, the percentage of males was 45%. Whereas the proportion of females was 42% in the year 2016, men work from home to save more money.
Moreover, men outstripped women by 13%. They were more productive the respective figure was 24% and 11%. Last but not least, the reason was easier childcare there was a yawning gap between boys and girls the percentage was 26% and 4% respectively in the year 2016 more women done work at home.
Overall, the ratio of males was highest as compared to females for money saving and productivity. Whereas, women have main reason to work from home was easier childcare.
Follow Us on IELTSFever Twitter
Also read: The Diagram Below Gives Information About the Hawaiian Island Chain
Leave a Reply