 (1)")
The chart below shows the percentage of young people in higher education in four different countries in 2000, 2005 and 2010. summarise the information by selecting and reporting the main features and make comparisons where relevant.
Sample Answer of The Chart Below Shows the Percentage of Young People in Higher Education
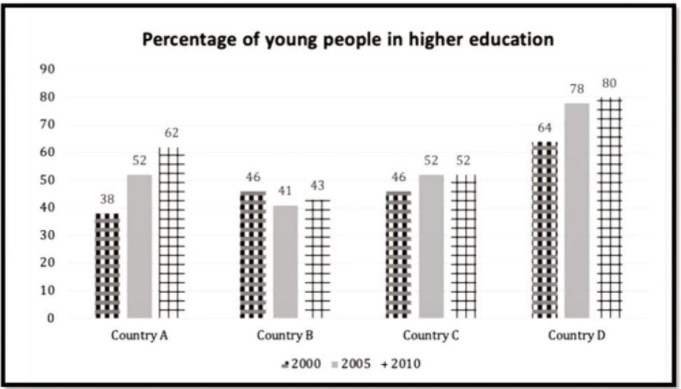
The bar chart represented compares and contrasts the difference between the proportion of young masses in higher studies in four various regions during a period of 2005 to 2010.
In general, as evident from the bar graph, the highest proportion of education by country D . However, the least percentage of country A. To begin with, as witnessed from the graph, in country A, almost 38% of people were interested in higher education in 2000, 52% in 2005, 62% in 2010. Then, from 2005 to 2010, in country B, the percentage of higher education fluctuated that was under a half.
Moving to ahead, in-country C, 46% youngsters were liked higher education in 2000, but 52% remained same in 2005 and 2010.
Afterward, more than three -fifths the masses were interested in 2005, but it was steadily increased in the next year that was near about four-fifths.
Follow Us on IELTSFever Instagram
Also, Read A Friend Has Agreed to Look after Your House and Pet while You Are on Holiday
Leave a Reply