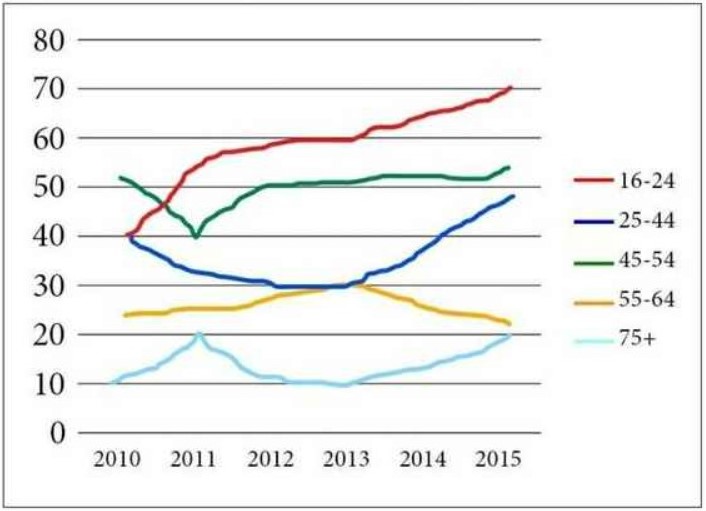
The graph below shows the percentage of people in different age groups in one city who attended music concerts between 2010 and 2015.
The line graph depicts the ratio of individuals in diverse age groups in a locality who took part in music show in five years.
There were only 10 percent people who did took part in melody concert in 2010, who was more than the age of 75. In the next year it increased by 10 percent. Afterthat a slight decline it reach at 20 percent in the year of 2015. Whereas, between the age of 55 and 64 people
were more interested to like music sessions. who never declined the ratio of 20. In fact, natives who were in middle age took part in music program which was 30 percent in the year of 2012 and increased upto almost 18 percent till 2015. On the other hand, after a sudden decrease ratio of people was remain same amoung those who were youngster which was almost 53 percent. Whereas, Teen agers were more interested in taking part in music session as ratio of people was always increased with the time remain at peek.
In conclusion, In every age group people there was fluctuation has been noticed in various times. Whereas, there were only increase in the ration of teen agers.
Follow Us on IELTSFever Twitter
Also Read The Chart Below Gives Information About “istanbul Promo Plus”


Leave a Reply