


The bar chart below shows the average duration of housework women did (unemployed, part-time employed, and full-time) when compared to men who had full-time work in the UK between 1985 and 2005. Summarise the information by selecting and reporting the main features, and make comparisons where relevant.

Sample Answer of The Bar Chart Below Shows the Average Duration of Housework Women Did
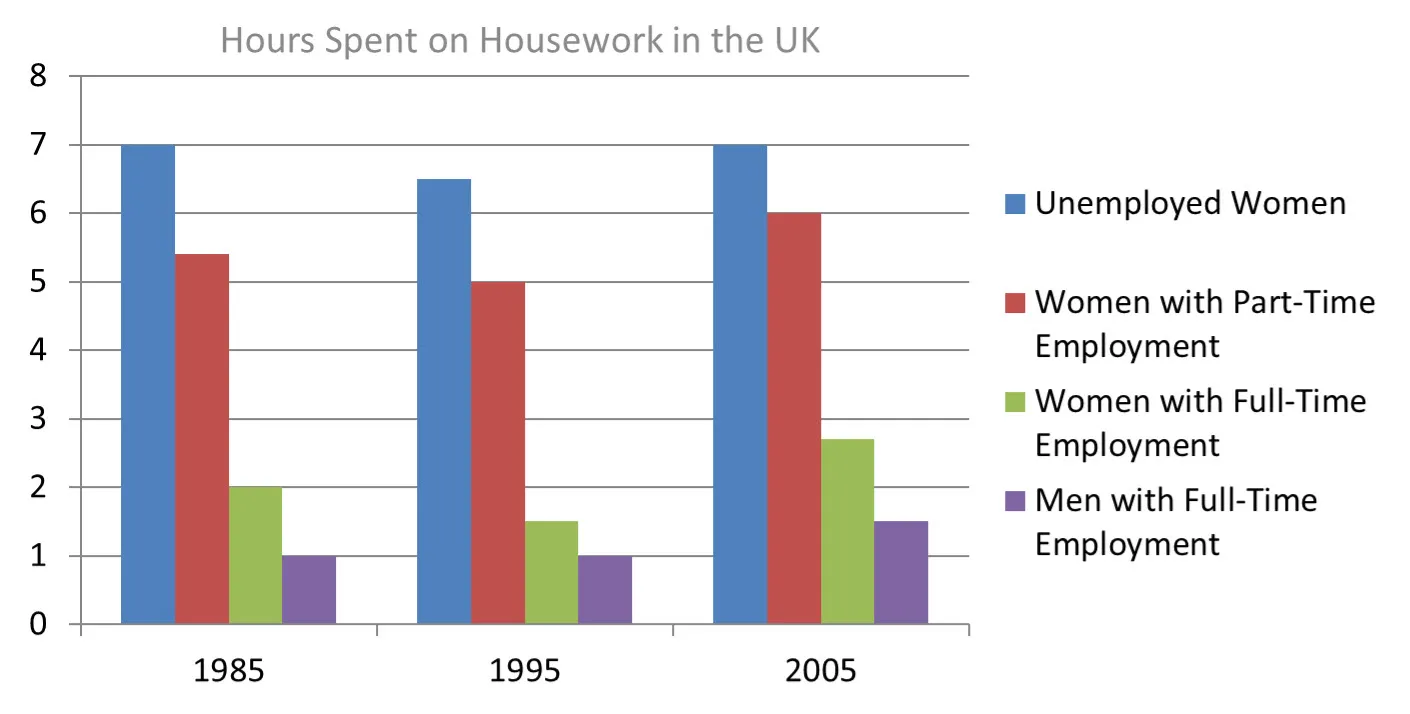
A glance at the bar graph provided illustrates the average time hours of daily chores done by Unemployed women, part-time employed women and full time employed women .which is compared to Full time working men in Great Britain in the duration of 1985 to 2005.
It is clear from the bar graph that Unemployed women’s did around 7 hours of maximum hours of Household works in between 1985 to 2005 while Men’s with full-time employment did only 1.5 hours of work which was Least in that period.
Women’s with part-time working employment did the average number of working hours in that period of time there were few fluctuations seen, but by the year of 2005 they ended up with six working hours. Likewise, women’s with full-time employment had UP’s and down’s in their working hours, but by the end of the period, they did daily chores for 2.5hours.
Overall the working hours of all types employed women’s were maximum as compared to the men’s with full-time employment, and there were few fluctuations seen in all the employees working hours.
Follow Us on IELTSFever Twitter
Also read: The Bar Charts below Provide Information about Percentages of Students