


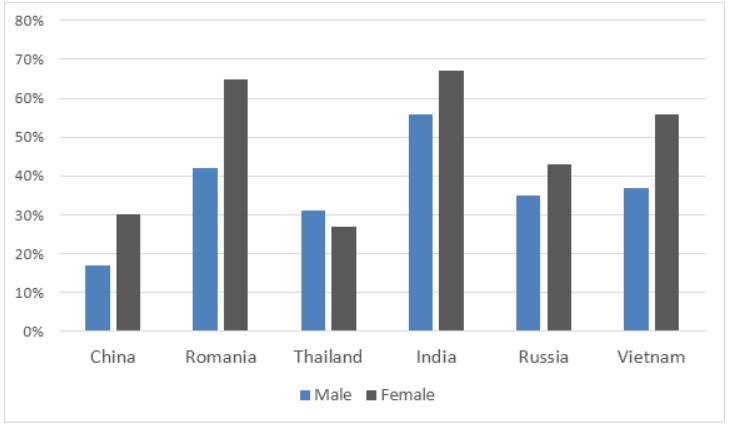
The bar charts below provide information about percentages of students who are proficient in a foreign language in different countries. Summarise the information by selecting and reporting the main features, and make comparisons where relevant.

The bar graph shows the relationship between educational levels and average salaries. Four educational salaries are presented with their average earnings on the bar chart.
As can be seen, earnings increase when an individual attains a higher educational qualification. Additionally, there is a large difference in incomes between a worker with a high school diploma and those with postgraduate qualifications.
High school diploma holders get paid $30 000 on average per annum, while employees with a Bachelor’s degree receive around 40 000 as remuneration, which is $10 000 more compared to the former. On the contrary, as workers achieve postgraduate qualifications such as a Master’s degree, they earn approximately $50 000. Thus, earnings reach almost 60% higher than that of personnel with high school diplomas.
Similarly, professionals who reach the Ph.D. level are entitled to incomes that are slightly higher than those with a Master’s. Hence the difference in salary between the two becomes gradually smaller.
Follow Us on IELTSFever Twitter
Also, Read Some People Think that in This Today’s World