


The table below shows the results of surveys in 2000, 2005 and 2010 about one university. Summarise the information by selecting and reporting the main features, and make comparisons where relevant.
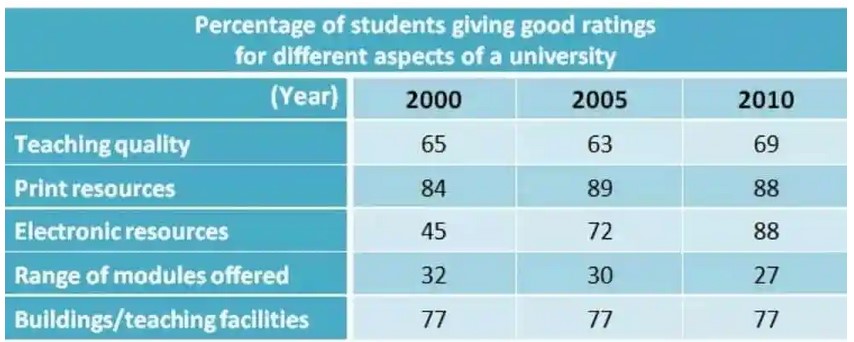

The table portrays the results of studies in three different years, namely 2000,2005 and 2010, about the proportion of pupils providing positive ratings for various features of a university.
According to the data demonstrated, generally, print resources had the maximum ratings through the three years of studies. On the contrary, the range of modules offered had the least ranking whereas the grading for building/ teaching facilities was constant in 2000,2005 and 2010 with 77.
It can be seen that the ratings of teaching quality (65) were more than twice those of the range of modules offered (32) in 2000. Additionally, in the same year of study, gradings of print resources roughly doubled that of electronic resources with 84 and 45 respectively. Furthermore, there was a negligible difference between the rankings of print resources in 2005 (89) and 2010 (88).
In 2010, there were equal ratings of print resources and electronic resources, with both having 88. Furthermore, teaching quality and print resources had fluctuating grades throughout the year of study, whereas ratings of electronic resources were significantly increasing with 45,72 and 88 in 200,2005 and 2010 respectively.
Follow Us on IELTSFever Twitter