


The pie chart shows the amount of money that a children’s charity located in the USA spent and received in one year, 2016. Summarize the information by selecting and reporting the main features and make comparisons where relevant.

Sample Answer of The Pie Chart Shows the Amount of Money that a Children’s Charity Located in the USA
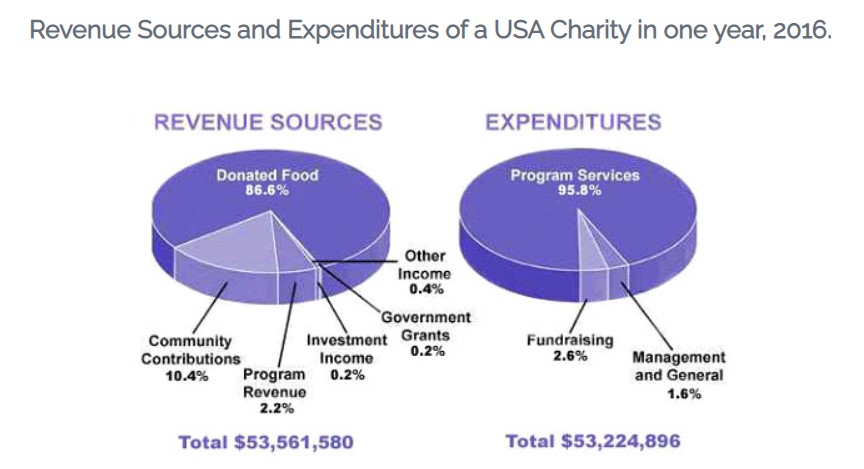
The pie chart represents the information about the amount of money that was used for the offspring’s charity located in the United States of America spent and received in the year 2016.
In the case of revenue sources, the highest amount of money was used for donated food which was 86.5 % in the year 2016. At the same time, community Contribution was only 10.4% in the USA. Moreover, investment income and government grants were similar, which was 0.2 % for children’s charity. However, the USA spent almost 2.2% on program revenue, and 0.4 % of the money was used for other income as well as the total amount was used for revenue sources was $53,561,580.
Furthermore, expenditure of USA charity in a year is almost 95.5% for program services. In addition, the amount of money was used for management and general, which was 1.6 % but for funding, and the amount was one time double from management and general. Last but not least, the total amount was $53,224,896.
Overall, the highest amount was used for food donated in revenue sources, and for expenditure, more money was used for program services.
Follow Us on IELTSFever Twitter
Also Read Some Believe that People Should Make Efforts to Fight Climate Change