


The graph shows the percentage of male and female academic staff members across the faculties of a major university in 2016. Summarise the information by selecting and reporting the main feature, and make comparisons where relevant.

The graph shows the percentage of male and female academic staff members across the faculties of a major university in 2016. Summarise the information by selecting and reporting the main feature, and make comparisons where relevant.
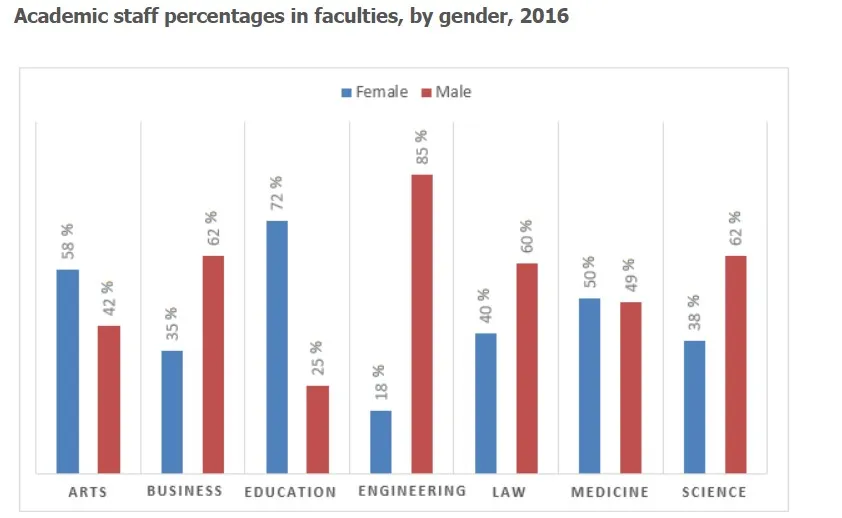
The bar chart represents the gender percentage of faculties of 2016 a major university. The faculties are divided into different education categories such as arts, business, education, engineering, law, medicine and science.
From the graph, it is visible that percentage of female faculties are more than male in arts, education and medicine sections. On the other end, male faculties are more in the other remaining sections.
From all the categories, there is a large percentage of male teachers in the engineering section than any other category. However, in the education section, females cover major places. Male teachers cover a minimum of 25% in all the categories, while female teachers cover a minimum of 18%. In the medicine section, both genders cover almost the same percentage. In arts, 58% of teachers are female, and the rest are male. In addition, in the education section, 72% are female, and 25% are male.
By compressing data, male faculties are more engaged in technical, logical and calculative sections and females are more engaged in education and art.
Follow Us on IELTSFever Twitter