


The graph below shows the Gross Domestic Products (GDP) in four selected countries between 2010 and 2015. Summarize the information by selecting and reporting the main features, and make comparisons where relevant.
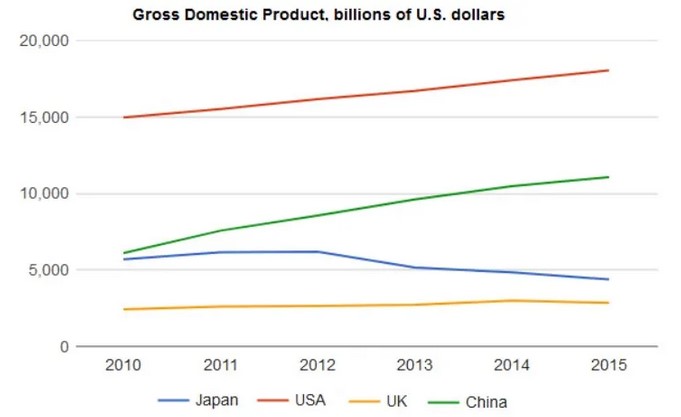

The graph demonstrates the gross domestic products of Japan, the United States of America, the United Kingdom, and China expressed In billions of U. S dollars over 5years(2010-2015). Overall, the U. S kicked off and maintained the highest GDP throughout, whereas U.K.’s GDP remained almost dormant throughout the period.
In 2010, the United States of America started with 15000 and rose steadily to its peak of about 18000 in 2015. On the other hand, the U.K., in the same year, had less than 5000 as Its GDP and remained stagnant till 2014 when it slightly moved Insignificantly with some fraction above 3000 and thereafter remained there till 2015.
Japan and China had fluctuations in their growth. On the one hand, China had about 6000 in 2010 and moved up at a steady speed till its peak of some fraction above 10,000 in 2015. On the other hand, Japan also had somewhat above 5000 and increased gradually till 2012 when it encountered a sharp drop off exactly 5000 in 2013, thereafter it started decreasing slowly till 2015 when they had less than 5000.
Follow Us on IELTSFever Twitter