


The graph below shows the average monthly use of health clubs in Miami and Florida by all full-time members in 2017. The pie charts show the age profile of male and female members of this health club. Summarise the information by selecting and reporting the main features, and make comparisons where relevant.
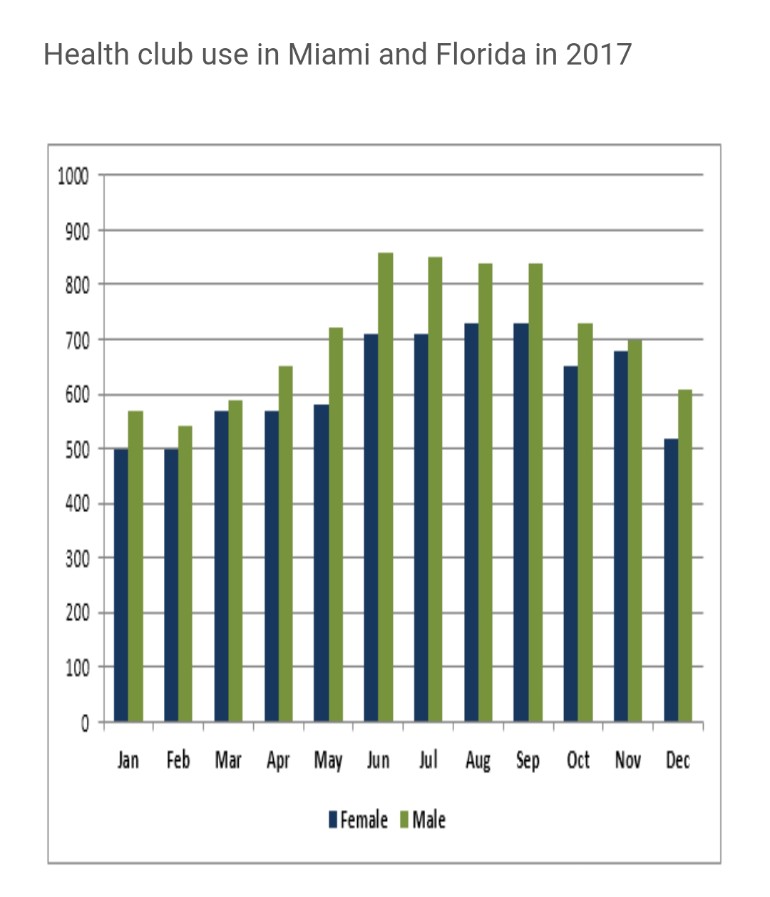

The bar graph and pie chart illustrate the number of full-time male and female health club members in Miami and Florida throughout the year 2017.
Overall, it is clear from the graph that males were more active users as compared to females, especially the age group between 21 – 45 years old.
According to the data, exact 500 females used the health club whereas the number of males users was slightly higher in the first month. This trend continued for the next four months; however, the average number of male users was over 800, at the same time number of females was roughly 700 up till September. At last, the structure of the graph goes on decreasing for the remaining months. Nevertheless, males users remain at the top of the chart.
According to the pie charts, the most active users belong to the age group 21-45 of which, 50% were women and over half were men. At the same time, a quarter of males members while females were 31% over 65 years old. The remaining age group had an exact 20% masculine members whilst the number of feminines were around it.
Follow Us on IELTSFever Instagram
Also, Read A Friend Has Agreed to Look after Your House and Pet while You Are on Holiday