


The graph below shows radio and television audiences throughout the day in 1992. Summarise the information by selecting and reporting the main features and make comparisons where relevant.

Sample Answer of The Graph Below Shows Radio and Television Audiences Throughout the Day in 1992
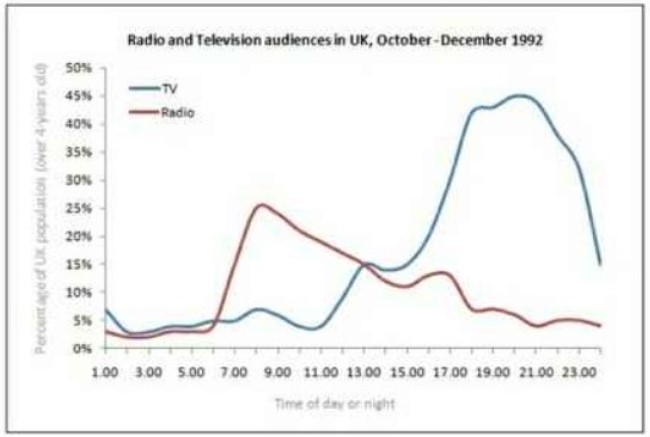
The given chart depicts data of audiences who watch TV and listen to the radio throughout the day in the UK from October to December in the year 1992.
Overall, it is apparent that most of the UK people were interested in watching TV rather than Radio.
Begin with radio, about 5% of people who were over four years old watch TV and listened to the radio at 1:00 am. This percentage remained about unchanged until the next day at 5:30 is. During the period from 7:00 am to 9:00 am maximum proportion of UK people who listened to the radio accounting for 25%, but the ratio decreased continuously after 9 am and recorded 6% at 11:00 pm.
Furthermore, with TV, the percentage fluctuated between 7% to 10% from 1:00 am until 11:00 am. The proportion of the UK population followed the upward trend from noon and touched its peak point recorded as about 45% at 9:00 pm before dwindled to 15% at 11:00 pm.
Follow us on IELTSFever Twitter for the latest updates
Also, Read Some People Today Prefer to Get Advice for Medical Problems