


The chart below shows information about the challenges people face when they go to live in other countries. Summarise the information by selecting and reporting the main features, and make comparisons where relevant.
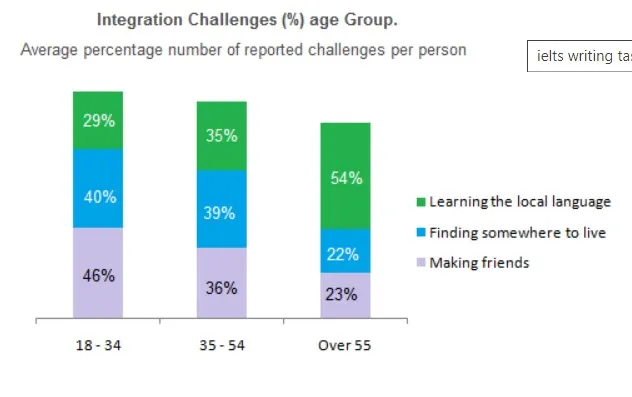

Looking from my overall perspective, it becomes evident that youngsters are good to make friends hand. It decreases when it becomes ages. At the same time, old people can learn the local language faster than the youth generation.
To begin with, youngsters and Middle East group people can find a place to live in another country which is 40% and 39 % respectively. Moreover, the 18 -34 age group are not good at learning a local language that is 35 per cent, and there is a dramatic increase in learning locker language in old people that is 54 per cent.
Furthermore, 46 per cent of youngsters are good at making friends which is higher than when compared to the other two age groups to making friends which is only 35 % and 23 % respectively.
Follow Us on IELTSFever Twitter
Also read: The Bar Charts Below Provide Information About Honey Production