


The chart below gives information about “Istanbul Promo plus” sales in 2007. Summarise the information by selecting and reporting the main features, and make comparisons where relevant. Write at least 150 words.
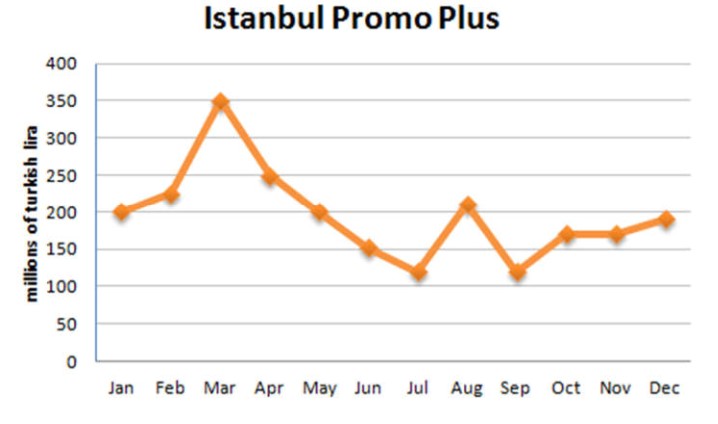

The given line graph compares data about the sales of Istanbul promo plus in the year 2007.
Overall, it can be seen that sales are high in February month and August month.
Interestingly, in January, the sales are started at 200 million Turkish lire. In the following two months, it rose gradually to around 225 million Turkish lire and reached a pinnacle of 350 million Turkish lire. On the contrary, after two months, the sales figure dipped considerably and remained the same as the initial month of the year.
Similarly, there was a significant decline from 200 million Turkish lire to nearly 110 million Turkish lire in July. In the following month, there was a steep rise to above 200 million of the Turkish lira and again declined slightly to same sales number of July. Between September and December, the sales number rose minimally from 110 million Turkish lire to just under 200 million Turkish lire.
Also, Read Talk about An intelligent person you know
Follow Us on Facebook IELTSfever